
Each student in the group must provide at least three graphs that make sense for the subject they are interested in.
Line graphs, Scatterplots, Bar graphs, histograms, word clouds, mosaics etc.
Create a presentation via R – Studio Remember to tell a story.
• Title – group members
• Intro – to topic, historic significance, reason of interest
• Findings – Data & Graphs
• Compare and Contrast as a group
• References
• Conclusion
• Tell a story!
• Graphs made sense to explain data
• Engaging
• Well-rehearsed
• Success in creating R-Presentation
Be sure there are no grammatical errors or typos. You may be selected to share your findings
on the Flipboard University page.
Topic:
Stock market : Internat Retail
https://www.kaggle.com/datasets/varpit94/amazon-stock-data
https://fred.stlouisfed.org/series/CPALTT01USM657N
• Amazon
• Alibaba
• Ebay
• Add more two companies
Make sure you make a record of what resources you use and from where.
Find Dataset you would like to use and share it with me.
Why are you interested in this Topic?
Educate me on what you know so far.
Please give abstract for this too n share dataset too
Give detail explanation of each graph n regarding the data set n topic too
Share the urls,resources if you are usung any info from web
It should be R presentation
STOCK MARKET: INTERNAL RETAIL
Introduction
Internal retail dataset of various companies is going to collect for comparing the different variables based on the dataset. An effective financial instrument is applied for evaluating the trending value based on the stock exchange. Several kinds of graphs have been prepared for describing the stock exchange by using the different components of the market economy.
Data links
Amazon:https://finance.yahoo.com/quote/AMZN/history?period1=1510704000&period2=1668470400&interval=1d&filter=history&frequency=1d&includeAdjustedClose=true
EBay: https://finance.yahoo.com/quote/EBAY?p=EBAY
Alibaba: https://finance.yahoo.com/quote/BABA?p=BABA&.tsrc=fin-srch
Apple: https://finance.yahoo.com/quote/AAPL?p=AAPL&.tsrc=fin-srch
Tesla: https://finance.yahoo.com/quote/TSLA?p=TSLA&.tsrc=fin-srch
Findings
In this project, five companies' data have been collected for explaining the stock details and the internal retail allows for gathering information about the economic condition of the company. Yahoo.com has been used for collecting the dataset of the company for evaluating the findings of the company (Kim and Won, 2018). An effective data analysis technique has been implemented to identify the condition of the company based on the economic basis.
Figure 1: Describe Alibaba data
The data has been used for describing the stock details of the Alibaba Company and the dataset allows for describing the economic condition of the company. The data can be seen for the Alibaba company where seven parameters of their stock market is presented.
Figure 2: Details of Amazon data
The Amazon company data has been gathered for evaluating the findings of the company. Details about the stock market of the Amazon data are presented in figure 2.
Figure 3: Describe Apple data
The stock market dataset has been collected for identifying the various factors of the Apple Company. The closing and opening price of the stock with which the Apple company is involved is presented above.
Figure 4: Describe EBay data
The above dataset has been implemented to explain the details of EBay Company and determine the financial security of the company.
Figure 5: Details of Tesla data
The above data allows for determining the liquidity to improve the security of the company effectively.
Figure 6: Histogram of amazon data
An appropriate interval range is used for evaluating the close variable by using the histogram plot. The histogram is generated for the closing price of the Amazon data. It is seen that the highest frequency is of prices that range between 120 and 140.
Figure 7: Histogram of Apple data
Frequency has been implemented for explaining the close variable based on the stock market data. Histogram for apple data showcases that same frequency is shared by ranges between 140 and 160.
Figure 8: Histogram of Alibaba data
Alibaba company data has been described by using the appropriate pattern to implement the close variable. In the above histogram the closing price of the “Alibaba” company is shown the closing price range of 70 to 80 is highest along with 90 and 100.
Figure 9: Histogram of EBAY data
A proper pattern, as well as the effective range, has been applied for describing the close variable. The closing price of the EBay is shown in histogram format where the highest frequency is for the range 45 and 50.
Figure 10: Histogram of Tesla data
Tesla company dataset helps to explain the close variable by using the appropriate interval. Closing prices of Tesla has more frequency than the other companies. The highest frequency is for prices between 250 and 300.
Figure 11: Scatter plot of amazon data
High has been selected in the x-axis and the open variable has been used in the y-axis for evaluating the Amazon data. The scatterplot is obtained so that a linear relationship between open and high prices of Amazon is gained.
Figure 12: Scatter plot of Apple data
The numerical data has been selected to explain the relationship between the variables for describing the stock market data. The scatterplot for high and open price of apple is also shown above.
Figure 13: Scatter plot of Alibaba data
A Scatter plot is implemented for explaining the stock market data based on the Alibaba Company. Linear relationship between the high and open price of Alibaba data is shown in figure 13.
Figure 14: Scatter plot of EBay data
An effective range of the interval is used for explaining the two variables by using the graphical plot. Similar to previous plots in this figure the scatterplot also follows a linear pattern.
Figure 15: Scatter plot of Tesla data
Open and high parameters have been applied for explaining the stock market data by using the scatter plot. The above plot indicates that the open price is linearly related with the High price of the data obtained for Tesla.
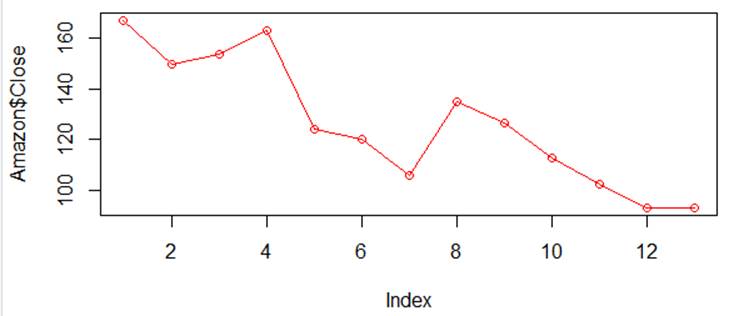
Figure 16: Line plot of amazon data
In this case, the volume variable has been implemented by using the line plot and the R programming language helps to describe the stock market data. The line plot shows the volume of Amazon changing with respect to time.
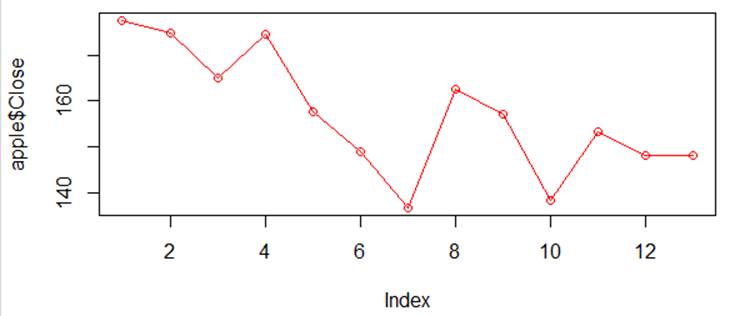
Figure 17: Line plot of Apple data
An appropriate line plot has been developed with the help of close variables for describing the stock market data. It is seen that the opening close is very high which drops significantly at the end of the day.
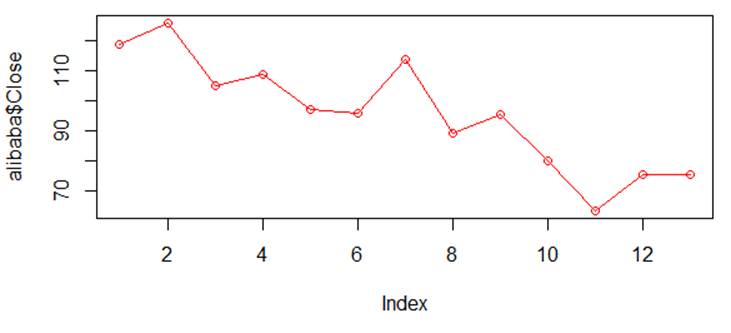
Figure 18: Line plot of Alibaba data
Alibaba company dataset has been implemented for describing the close variable by using the line plot. It is seen that the opening close is not very high however it reaches the peak between the range of 2 and 4.
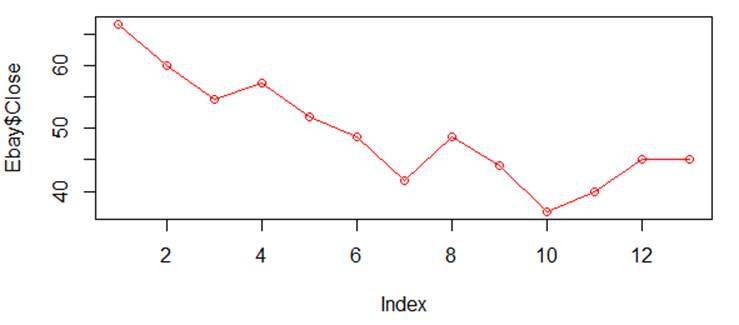
Figure 19: Line plot of Ebay data
An appropriate range has been used for explaining the details of the close variable of EBay Company. The starting close is very high for the EBay data which drops down after crossing the index 12.
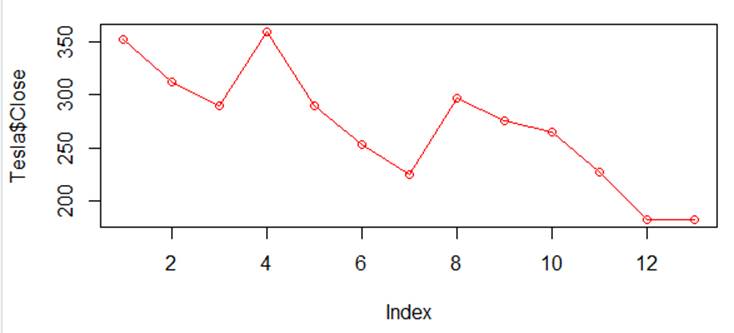
Figure 20: Line plot of Tesla data
The close variable of the Tesla Company has been selected for understanding the details of the company. The close of Tesla is changing at a range between 1.0e+09 and 2.0e+09 but drops after crossing 12.
Compare and contrast
In this project, three types of graphs such as line plots, histogram plots, as well as scatter plots have been developed for explaining the financial data of the selected companies. For Amazon Company, the highest frequency has been seen in the range of 120 to 140, and the highest frequency for Apple Company has been observed in different ranges such as 140 to 160 and 170-180. On the other hand, the 70-80 and 90-100 range has the highest frequency for the close variable of Alibaba Company. Only one point such as the 45-50 range has the highest frequency for describing eBay company stock data (Sasmitoet al. 2020). Tesla company dataset has been used for describing the close variable and the 250 to 300 range has been selected for determining the highest frequency.
For Amazon Company, a scatter plot has been shown to determine the relationship, as well as the open and high variables, are directly proportional. Open and high variables do not depend on each other for describing the relationship. A specific pattern has been followed for describing the relationship between the high and open variables for Alibaba Company. EBay Company for the variable has been used for explaining the dataset and a directly proportional relationship has been implemented for describing the variables (Harreret al. 2021). Tesla company dataset has been used to describe the relationship and a directly proportional relationship has been applied for describing the stock details of the company.
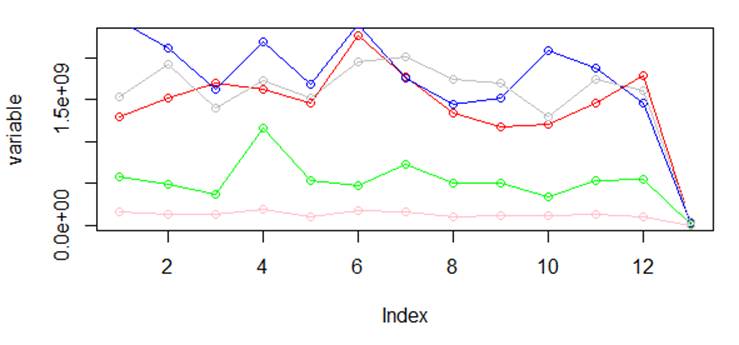
Figure 21: Multiple line plots of comparison
Amazon dataset based on the volume variable has been selected for identifying the highest point, as well as the lowest point of the dataset by using the stock market data. For the apple company, various fluctuations are noticed in describing the volume variable of the stock market data. For Alibaba Company, the highest point has been noticed in the line plot for describing the stock market data. In this case, EBay Company has a similar graphical plot to Apple Company (Verbruggenet al. 2019). Tesla Company has a different fluctuating point for explaining the stock market data of the company.
Conclusion
The report sheds light on the stock marketing data of the companies and the R programming language has been implemented for describing the economic condition. An effective stock analysis method is implemented for explaining the stock details of the company, as well as to identify the economic condition.
References
Harrer, M., Cuijpers, P., Furukawa, T.A. and Ebert, D.D., 2021. Doing meta-analysis with R: A hands-on guide. Chapman and Hall/CRC. Available from: https://pdfs.semanticscholar.org/136a/939ce8ade8fc8ecbcc2ea68c73d9d9d78c2d.pdf
Kim, H.Y. and Won, C.H., 2018. Forecasting the volatility of stock price index: A hybrid model integrating LSTM with multiple GARCH-type models. Expert Systems with Applications, 103, pp.25-37. Available from: https://www.sciencedirect.com/science/article/pii/S0957417418301416
Sasmito, S.D., Sillanpää, M., Hayes, M.A., Bachri, S., Saragi‐Sasmito, M.F., Sidik, F., Hanggara, B.B., Mofu, W.Y., Rumbiak, V.I., Taberima, S. and Nugroho, J.D., 2020. Mangrove blue carbon stocks and dynamics are controlled by hydrogeomorphic settings and land‐use change. Global change biology, 26(5), pp.3028-3039. Available from: https://onlinelibrary.wiley.com/doi/pdf/10.1111/gcb.15056
Verbruggen, F., Aron, A.R., Band, G.P., Beste, C., Bissett, P.G., Brockett, A.T., Brown, J.W., Chamberlain, S.R., Chambers, C.D., Colonius, H. and Colzato, L.S., 2019. A consensus guide to capturing the ability to inhibit actions and impulsive behaviors in the stop-signal task. elife, 8, p.e46323. Available from: https://elifesciences.org/articles/46323.pdf
Appendix
|
library(readr)
Amazon <- read_csv("E:/data/AMZN.csv")
apple<- read_csv("E:/data/AAPL.csv")
alibaba<- read_csv("E:/data/BABA.csv")
Ebay<- read_csv("E:/data/EBAY.csv")
Tesla<- read_csv("E:/data/TSLA.csv")
#histogram
hist(Amazon$Close)
hist(apple$Close)
hist(alibaba$Close)
hist(Ebay$Close)
hist(Tesla$Close)
#scatter
plot(x = Amazon$High,y = Amazon$Open,
xlab = "High",
ylab = "Open",
main = "Amazon High vs Open"
)
plot(x = apple$High,y = apple$Open,
xlab = "High",
ylab = "Open",
main = "apple High vs Open"
)
plot(x = alibaba$High,y = alibaba$Open,
xlab = "High",
ylab = "Open",
main = "alibaba High vs Open"
)
plot(x = Ebay$High,y = Ebay$Open,
xlab = "High",
ylab = "Open",
main = "Ebay High vs Open"
)
plot(x = Tesla$High,y = Tesla$Open,
xlab = "High",
ylab = "Open",
main = "Tesla High vs Open"
)
#line
plot(Amazon$Close, type = "o", col = "red")
plot(apple$Close, type = "o", col = "red")
plot(alibaba$Close, type = "o", col = "red")
plot(Ebay$Close, type = "o", col = "red")
plot(Tesla$Close, type = "o", col = "red")
#mutiple line plot
plot(Amazon$Volume, type = "o", col = "red", ylab = "variable")
lines(apple$Volume, type = "o", col = "blue")
lines(alibaba$Volume, type = "o", col = "green")
lines(Ebay$Volume, type = "o", col = "pink")
lines(Tesla$Volume, type = "o", col = "grey") |